
Introducing the 'ElevAIting Eleven': The Stocks Driving Today's Market
Beyond the Magnificent 7: How a select group of mega-cap, AI-driven stocks are dominating the market, fueled by narrative and outsized valuations.


It’s always a risky undertaking to predict the future of the markets. The only truly safe forecast is to echo the famous anecdote about J.P. Morgan, who, when asked about the stock market’s future, simply replied: “It will fluctuate.”
Still, we need some way to understand where we are and whether the market, in aggregate, is expensive or not.
This is not a deep, comprehensive analysis—just a few reflections.
So, what’s the weather like today? Is the market expensive in December 2025?
In short: yes and no.
Buffett indicator
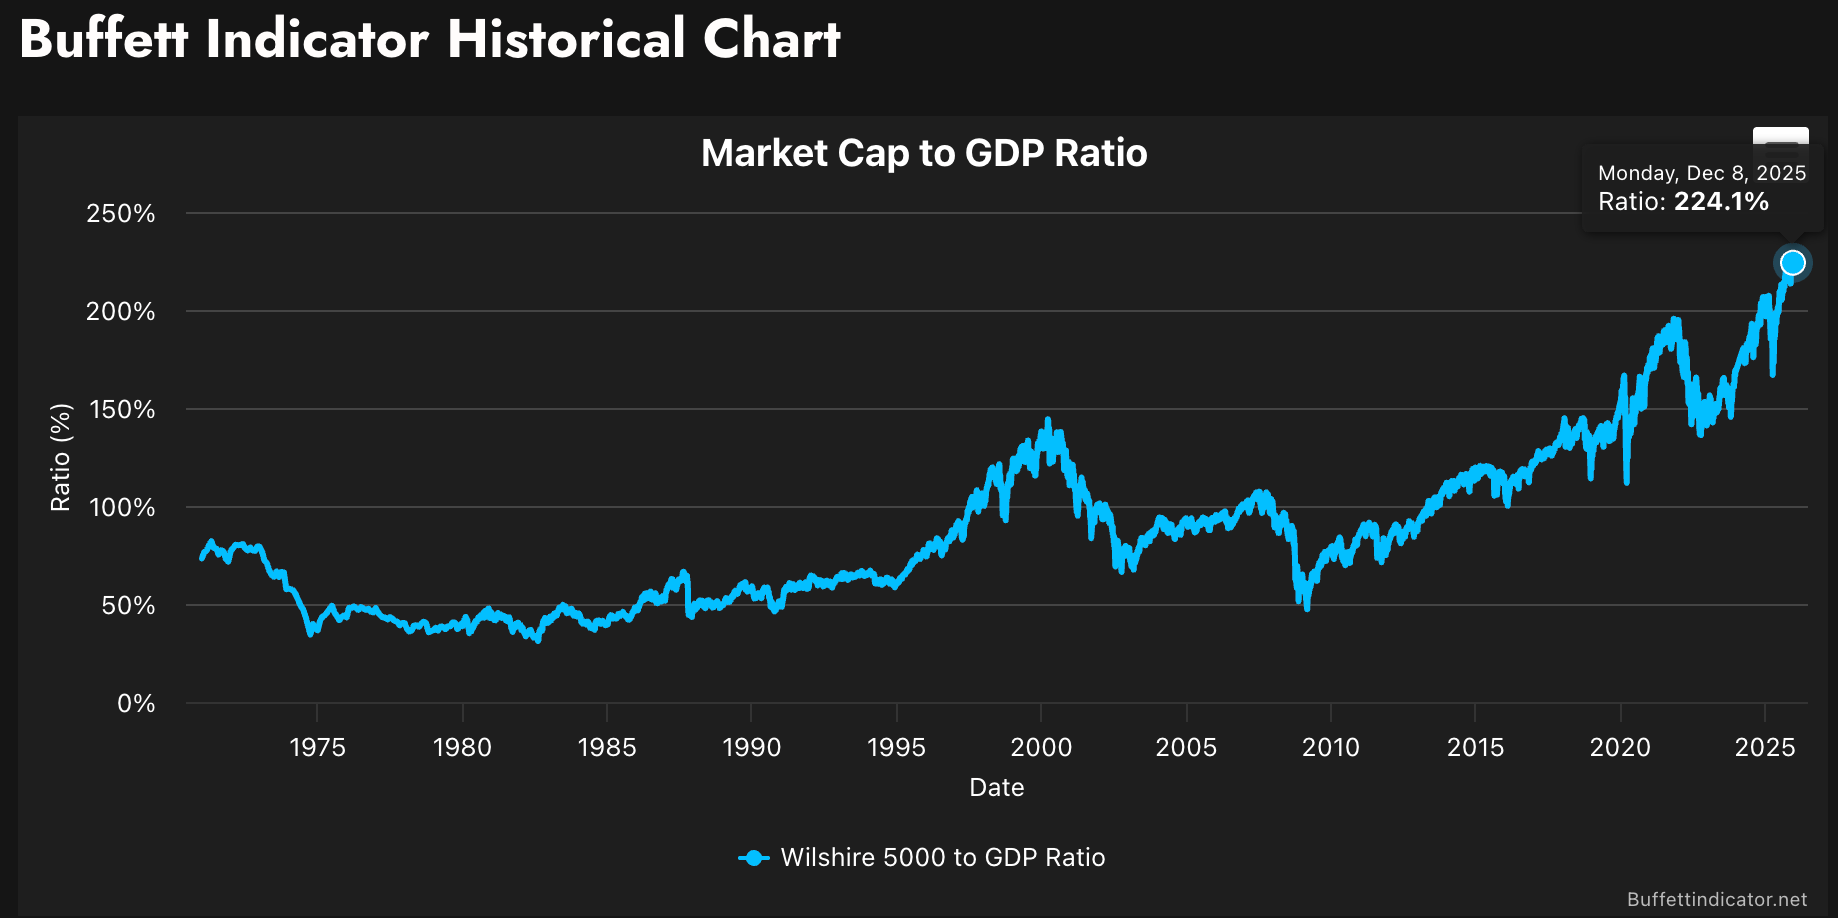
Let’s start with the so‑called Buffett indicator, a measure popularized by one of the most successful investors of all time. It compares the total value of a country’s stock market to its gross domestic product (GDP), giving a high‑level sense of whether equities, in aggregate, are cheap or expensive relative to the size of the real economy.
A quick note on scope: even though we’re talking here about the overall “market weather,” the classic Buffett indicator is defined for specific countries. In his original remarks, Buffett referred to the ratio of total market cap to U.S. GNP, but most contemporary implementations (including the sources we use here) now use GDP instead. For that reason, in this section we’ll focus on the United States – the largest and most influential equity market, and roughly 60% of global stock‑market value as of late 2023–2024 (see Visual Capitalist).
There are now attempts to generalize this “Buffett indicator” framework to other countries and even to a global aggregate – for example, GuruFocus tracks market‑cap‑to‑GDP ratios across major markets and a global composite – but the original and cleanest version is still the U.S. case.
When you look at the Buffett indicator for the U.S. today, it is extremely elevated. According to GuruFocus, the ratio of total U.S. market cap to GNP stands at about 224.1% as of December 2025, essentially matching its all‑time high (the previous peak was roughly 224.2% in November 2025). That puts the U.S. market in the “Significantly Overvalued” bucket – we’d be comfortable describing it as strongly or even extremely overvalued. For comparison, during the dot‑com bubble peak in early 2000 the Buffett indicator was materially lower than it is today, even though that period is now a textbook example of an equity bubble.
That obviously begs the question: are we in a bubble right now? Before we get into that, it’s worth looking at the structure of the market. The Buffett indicator only tells us about the total market value; how that value is distributed can lead us to slightly different conclusions.
S&P 500
The most widely-used benchmark for U.S. stock investing is the S&P 500 index. While the full rationale for its prominence is a topic for another discussion, for now the important one is its sheer size: the S&P 500 alone represents roughly 70–80% of the total U.S. stock market capitalization, and therefore dominates broad “total market” indices such as the Wilshire 5000. In other words, when we talk about “the U.S. market”, we are mostly talking about the S&P 500 anyway. And even if we often look for great companies outside the S&P 500, its weight is still of key interest, simply because this is where most of the capital gets allocated. The structure of that capital allocation is especially important in times when bubbles are suspected.
As of S&P 500, from its bear‑market low around 3,600 in 2022, it has more than recovered and gone on to set a long series of new all‑time highs in 2024 and 2025 (the index is now above 6,800 as of December 2025; see, for example, price history here: https://www.investing.com/indices/us-spx-500-historical-data). In other words, by any conventional benchmark, U.S. large‑cap equities are trading at or near record levels, mind you, in relatively short time-span (it is important due to inflation concerns).
This is visible on the very basic chart (for last 30 years):
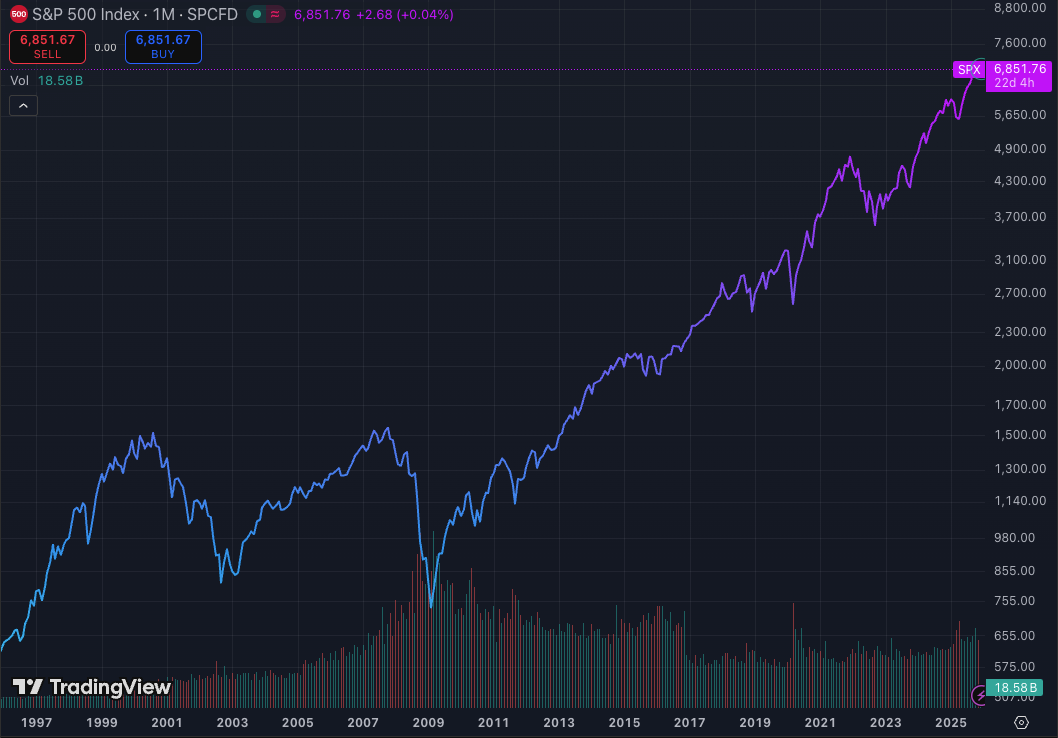
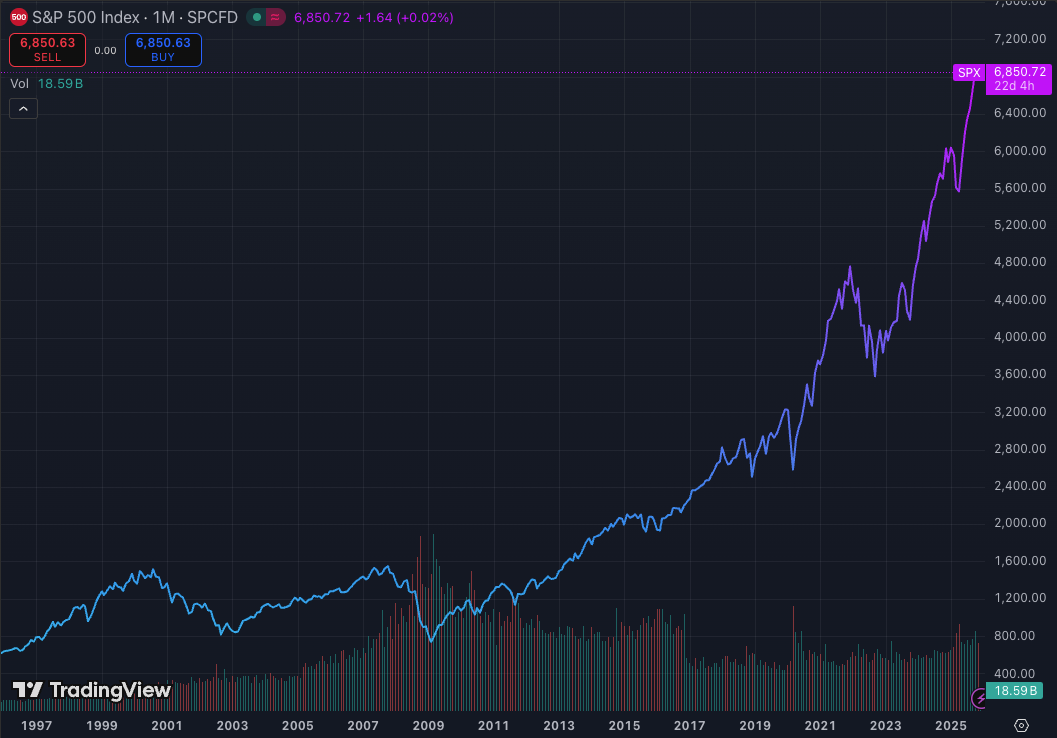
Be aware that it is logarithmic view, things get really clear when going linear:
Coming back to inflation. Using a single dataset (OfficialData’s CPI and S&P 500 total‑return series), cumulative U.S. consumer price inflation from 2022 to 2025 comes out to roughly 10–11%, which corresponds to a CPI compound annual growth rate of about 3–4% per year over this three‑year window (see: OfficialData – inflation).
Over a slightly longer window in the same era – from early 2022 to mid‑2025 – the S&P 500 has delivered a total return of about +48%, or roughly 11–12% per year with dividends reinvested (see: OfficialData – S&P 500).
To sum up:
– Inflation CAGR (2022–2025 CPI): ~3–4%
– S&P 500 CAGR (early 2022 to mid‑2025, total return): ~11–12%
That’s a pretty big gap between price growth and underlying inflation over a relatively short time span.
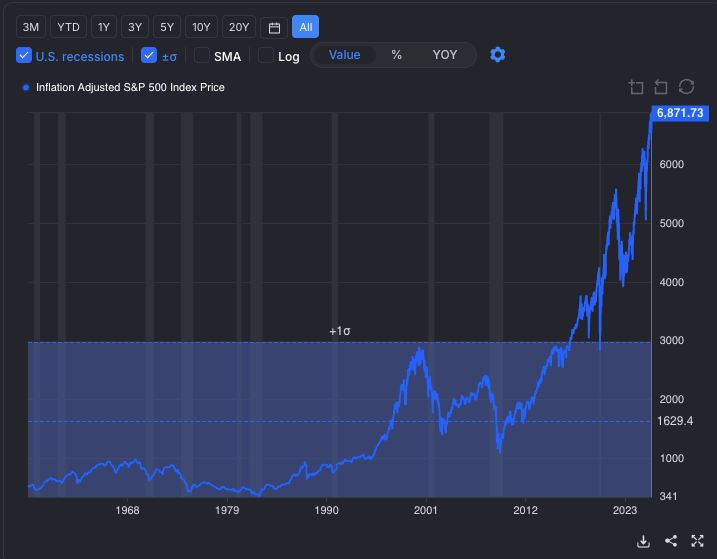
And we can see it on the chart, too. Below is the S&P 500 adjusted for U.S. inflation (the formula used in TradingView is SP:SPX/ECONOMICS:USCPI).
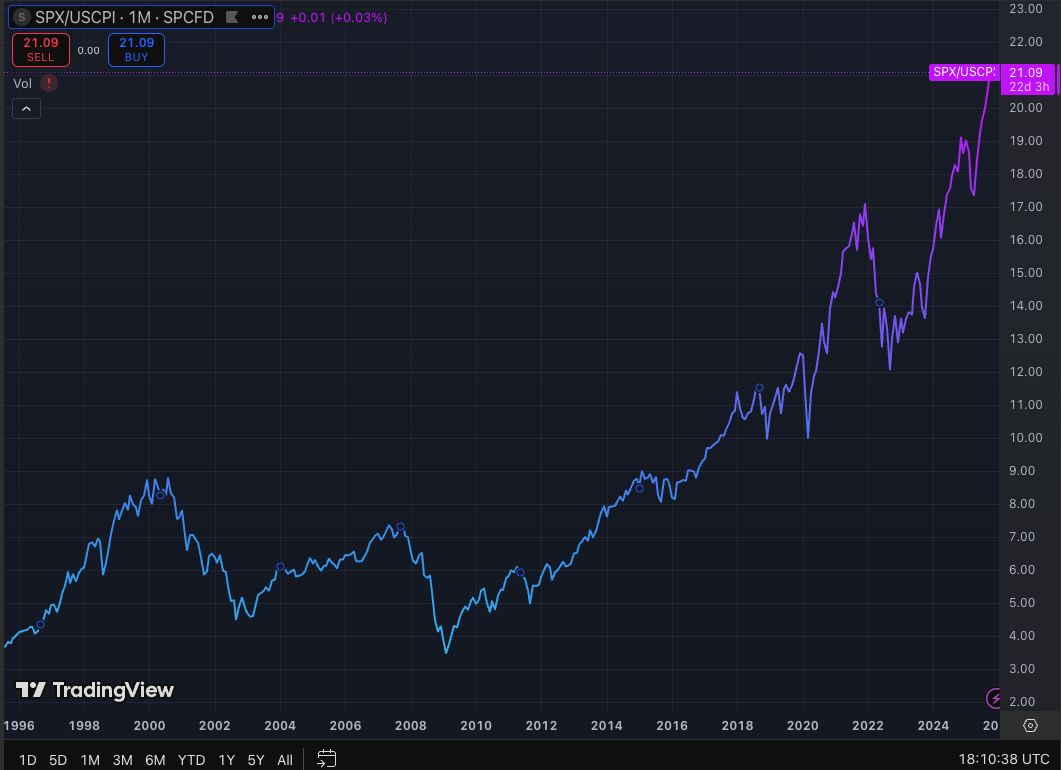
A different way to see the same point is to look at GuruFocus’s inflation‑adjusted S&P 500 chart, which plots the index together with its long‑term average and a “normal” band around that average (one standard deviation). Today’s inflation‑adjusted S&P 500 is not just above its historical mean—it is far, far beyond this usual band. In plain language, the current real price level is statistically extreme relative to what has been normal over past decades, even after accounting for inflation.
So, put bluntly: if someone is telling you this market is “not expensive”, they’re probably selling.
The ElevAIting Eleven
We started with the global equity market, then focused on the U.S. (which accounts for well over half of global stock‑market value), then narrowed further to the S&P 500 (which captures the bulk of U.S. large‑cap equities). Now let’s look at what actually drives the S&P 500 itself.
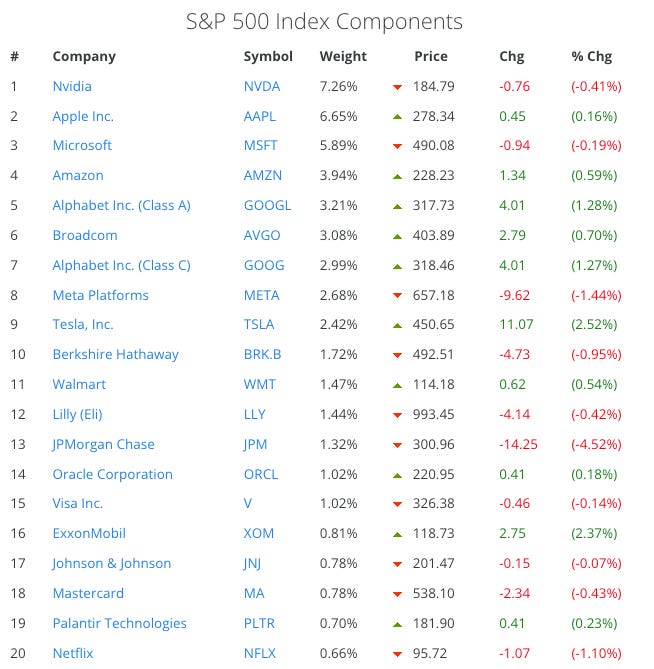
The S&P 500 is not an evenly balanced basket of 500 companies; it is heavily dominated by a handful of mega‑caps. As of late 2025, the so‑called “Magnificent 7” (Apple, Microsoft, Alphabet, Amazon, Meta, Tesla and Nvidia) alone account for well over a quarter of the entire index’s market value, and the top twenty constituents together make up almost 50% of the index (49.84%, to be precise).
This is astonishing: just 20 top companies make up nearly half of the entire index!
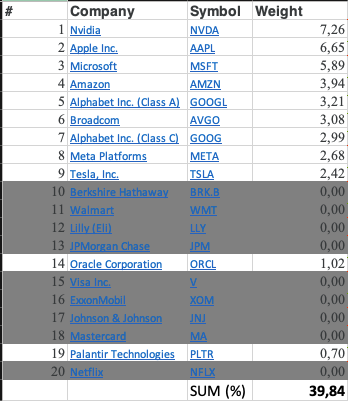
But that’s for the top twenty companies, a group that also includes more traditional conglomerates like Warren Buffett’s Berkshire Hathaway or Johnson & Johnson. We therefore decided to tweak this 20‑stock group: starting with the Magnificent 7 and then extending it to include a few other AI‑related and likely overvalued names, while excluding more “boring” blue chips such as Berkshire or Visa. The final group looks as follows:
Nvidia,
Apple Inc.,
Microsoft,
Amazon,
Alphabet Inc. (Class A),
Broadcom,
Alphabet Inc. (Class C)1,
Meta Platforms,
Tesla, Inc.2,
Oracle Corporation
and Palantir Technologies.
With this adjustment, we end up with eleven stocks—the ElevAIting Eleven—that together represent almost 40% of the S&P 500 by weight (39.84% in my snapshot)3. In other words, when the S&P 500 makes new highs, a very large share of that move is being driven by a tiny group of AI‑ and tech‑related giants, not by a broad, evenly shared boom across the corporate sector.
So, is it safe to jump onto this ElevAItor?
Stay tuned for the next part — though we suspect you already know what our answer will be.
- Michał, CyberMoat
Uncovering risks, securing opportunities.
Alphabet note: Alphabet appears twice in the list (Class A – GOOGL, and Class C – GOOG). These are two share classes of the same company, but the S&P 500 treats them as separate constituents with separate weights. Therefore, we include both when calculating the basket’s share of the index and treat them as separate entities for the purpose of this “ElevAIting Eleven” count.
Tesla note: Tesla has long looked expensive, but in the current environment its valuation is particularly hard to square with fundamentals (a topic we may return to separately). It is also deeply tied into the AI narrative and remains one of the market’s purest hype stocks. That combination is why Tesla is included in the ElevAIting Eleven.
Methodology note: The ElevAIting Eleven are not meant to be a precise academic construct, but rather a practical way to capture the small group of mega‑cap, AI‑narrative stocks that currently dominate index performance and market psychology. They share three traits: (1) very large index weights, (2) a central role in the AI story (in chips, cloud, platforms, or “AI-washed” narratives), and (3) valuations that are at least partly explained by that AI enthusiasm rather than by fundamentals alone.