
Is It Safe to Jump Onto the ElevAItor?
A Closer Look at the ElevAIting Eleven and the Final Phase of the AI Bubble


Recently we were talking about overvaluation in the stock market in general, with its main driver being the “ElevAIting Eleven” – 11 stocks that together make up about 40% of the S&P 500 index. This matters a lot, as the S&P 500 represents roughly 70–80% of the total U.S. stock market capitalization, which in turn accounts for more than half of the entire world’s market cap.
We demonstrated that the market is definitely overheated, with the Buffett Indicator at a historical high of around 224%.
This is obviously not a good environment for a cautious investor, as with extreme valuations the risk is close to extreme, while the potential return is minimal. That doesn’t mean it’s impossible to make money – it simply means that, on average, the odds are stacked against you and the probability of a loss is elevated when we talk about the market in general, for example when investing in an index like the S&P 500. To give you some idea: out of each dollar invested in the S&P 500, roughly 40 cents goes to fuel our ElevAIting Eleven – not a great distribution, regardless of the potential quality of these companies.
But let’s take some look at the companies in question, to give you just an idea how they compare vs market and vs history.
Overview of rough valuation - ElevAIting Eleven
When one attempts to value a company, proper measures are needed. There are many indicators used by investors in the analysis process. The one most widely used (although having its deficiencies) is the price-to-earnings ratio (P/E), simply calculated as:
P/E Ratio = Share Price / Earnings per Share
or alternatively:
P/E Ratio = Market Cap / Net Income
One intuitive way investors often think about the P/E ratio is as a very rough “payback period.” If a stock trades on a P/E of 20, you are effectively paying $20 for every $1 of the company’s current annual earnings. If those earnings stayed flat and were fully paid out to you, it would take about 20 years for the company to earn back the price you paid.
Of course, in the real world earnings change, companies reinvest instead of paying everything out, and inflation matters, so this is only a mental model – not a formula – but it helps anchor what a given P/E actually feels like.
While this measure is not perfect, let’s stick to it in our simple overview to get a very general idea of how the market values the companies in question right now.
NVIDIA
Let’s start with the brightest (and heaviest, market-cap‑wise) company from the ElevAIting Eleven: NVIDIA.
A quick look at the P/E chart dating back to late 2011 may at first give the impression that NVIDIA is not very expensive:
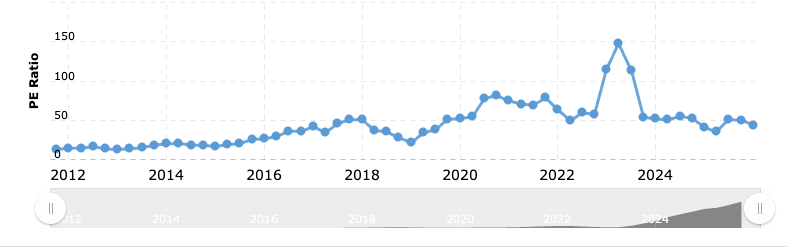
NVIDIA PE ratio as of December 15, 2025 is 45.79 (source).
While this is not a stratospheric multiple for a company like NVIDIA, it is still rather a demanding one. Using our mental model, it means we’re willing to pay almost $46 today for every $1 of NVIDIA’s current annual earnings. In other words, if earnings stayed flat and were fully paid out, it would take more than 45 years for the company to “earn back” the price we’re paying.
A comment for those primarily looking at charts: at first glance, NVIDIA’s P/E chart can be quite misleading for inexperienced or hot‑tempered investors. There is a sharp spike around 2023–2024, driven by a brief but extreme disconnect between price and reported earnings. That spike pulls the visual “average” way up and makes today’s valuation look almost moderate.
The reality is more nuanced. Yes, today’s P/E is below that spike and slightly below the recent historical average – but it still represents a hefty price tag. Even after the AI‑mania excess has cooled a bit, you are paying a demanding multiple for NVIDIA’s current earnings. Given the company’s quality and unique position in the AI ecosystem, this may be one of the closer‑to‑normal valuations among AI leaders – but it is certainly not a cheap stock.
Apple
Now let’s look at Apple. No surprises in the P/E chart – it clearly shows where we are: firmly in the “expensive” camp.
Apple’s P/E ratio as of December 15, 2025 is 36.69.
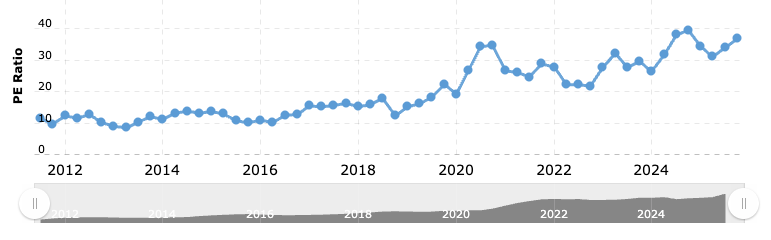
It trades at roughly 36–37× earnings, which is near its historical highs. Compare that with the P/E when Buffett was building his position: Berkshire first bought Apple in the first quarter of 2016, when the stock was trading at roughly 10–15× earnings – a far cry from the multiples investors are willing to pay today.
Perhaps we are blind to something and can’t see Apple’s potential – but it rather looks to us that Apple on the eve of 2026 is in a very different situation than it was in early 2016.
When Berkshire started buying Apple in early 2016, this was not some overlooked niche player. Apple was already one of the largest, most profitable companies in the world – but the market largely treated it as a cyclical hardware business approaching “peak iPhone”. The stock traded at roughly 10–15× earnings, as if growth were about to stall permanently. In hindsight, that was exactly the moment when Apple’s true potential – the installed base, services, and ecosystem lock‑in – was about to be recognized and re‑rated by the market.
Back then, the business was strong and underappreciated, while the valuation was modest. Today, we’d argue the opposite: a business that feels less dynamic and innovative than in the past, paired with a valuation that assumes it will still be one of the main winners of the AI era. Will it?
To sum up, a current P/E of around 35+ looks really demanding. Perhaps that is part of the reason Warren has cut Berkshire’s position substantially.
Broadcom
Next, let’s look at Broadcom. As with NVIDIA, a quick glance at the P/E chart suggests there may have been at least one period of temporary disconnect between price and reported earnings – a familiar pattern in this cycle.
Let’s fix it by mentally skipping that anomaly and focus on the more recent history from 2018 onward:
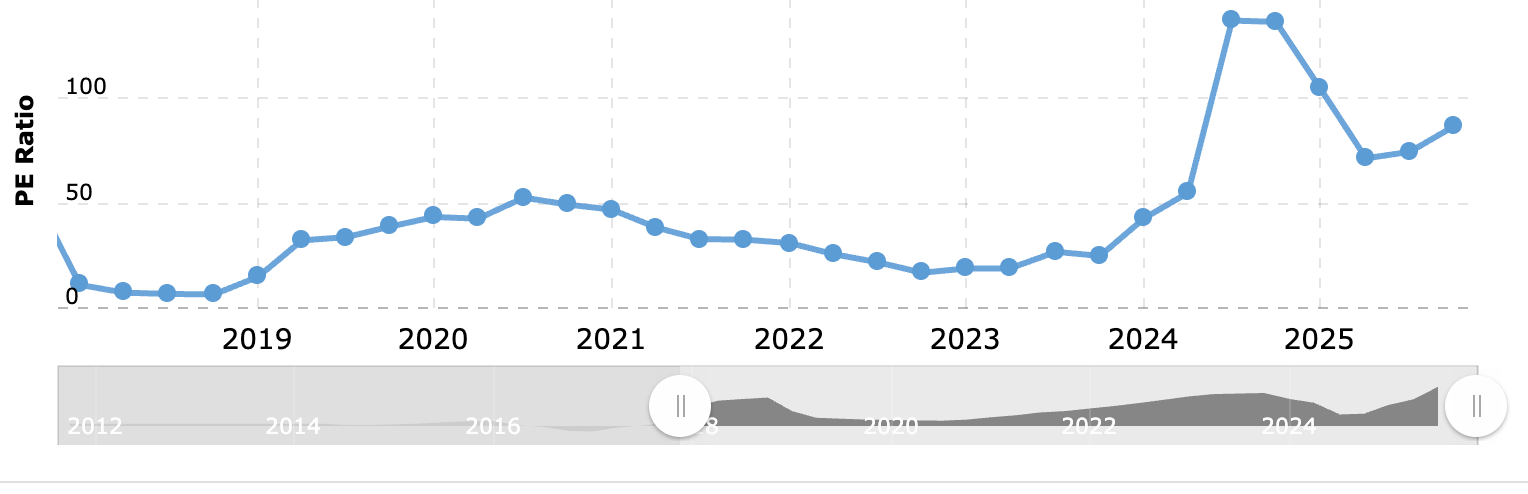
Looking at the chart starting in 2018, Broadcom’s P/E gradually climbs from low double digits into the 30–50× range, before spiking above 100× in 2024 and then settling back down. Even if we ignore the brief trip into triple‑digit territory as another earnings/price mismatch, the “normal” range over the last few years still looks elevated by historical standards.
Broadcom PE ratio as of December 15, 2025 is 60.68.
Using our mental model, that means we are paying over $60 today for every $1 of Broadcom’s current annual earnings. In other words, if earnings stayed flat and were fully paid out, it would take more than 60 years for the company to “earn back” the price we’re paying. That is a clearly demanding multiple, even if we imagine Broadcom is a high‑quality infrastructure player – and we are not fully convinced it deserves that label.
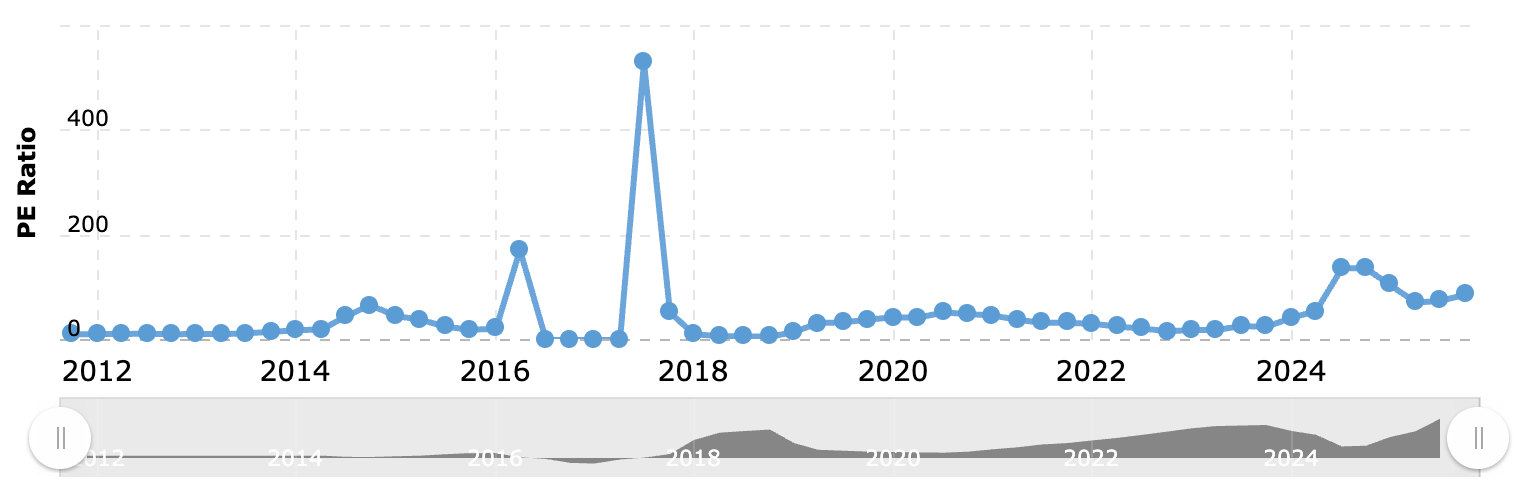
Palantir Technologies
The last of the ElevAIting Eleven we wanted to look at is Palantir Technologies. This one is especially interesting, because it may be a perfect example of how AI hype can drive arguably unreasonable expectations.
Palantir only very recently crossed into GAAP profitability. 2023 was its first fully profitable year, and by late 2023 it had finally strung together the four consecutive profitable quarters needed to become eligible for S&P 500 inclusion – a milestone Alex Karp proudly highlighted in the Palantir Q3 2023 shareholder letter. In other words, the company just managed to show “official” break‑even at the precise moment when index eligibility became a big narrative.
You don’t have to be a conspiracy theorist to suspect that at least part of this sudden “profitability” story is cosmetic. When a business is hovering around break‑even, relatively small shifts in assumptions – around stock‑based compensation, capitalization versus expensing of development, or the timing of revenue recognition – can flip the bottom line from red to black without any fundamental change in the underlying economics. This is very close to what Michael “The Big Short” Burry has been warning about in his recent short thesis on Palantir and Nvidia, arguing that much of the apparent profitability in some AI darlings evaporates once you treat stock‑based compensation and aggressive accounting choices as real economic costs rather than harmless add‑backs (Moneycontrol).
As of December 15, 2025, Palantir Technologies’ P/E ratio is 538.97. (!!!)
It is an absurd number, because the valuation itself is absurd: a company that has only just made it into the S&P 500 during the peak of the AI hype cycle now carries a market capitalisation near $450 billion, on roughly $3.9 billion of trailing‑twelve‑month revenue as of September 2025.
From our perspective, the idea that a business with such a thin and recently achieved earnings record has already been welcomed into the S&P 500 says more about the current cycle than about Palantir’s true quality. Yes, by the index rulebook Palantir is now technically an “earning” company – but only just, and in a way that still feels fragile.
There is also a genuine tension here. On one hand, Palantir looks like a real business with cutting‑edge technology, high switching costs, and improving cost discipline. Its moat is impressive, and its quality metrics are even more so: free‑cash‑flow margin around 46%, fast growth, and strong long‑term prospects. Palantir is a great company and possibly a genuine compounder in the future. On the other hand, no tree grows to the sky. Even a strong, defensible business can be priced so aggressively that the investment case becomes fragile. With an extremely high valuation like Palantir’s, the odds are high that the “sky” may have been reached sometime around late October 2025.
If you look at Palantir’s P/E chart, the line sits at 0 up to mid‑2023 and then suddenly explodes into triple digits.
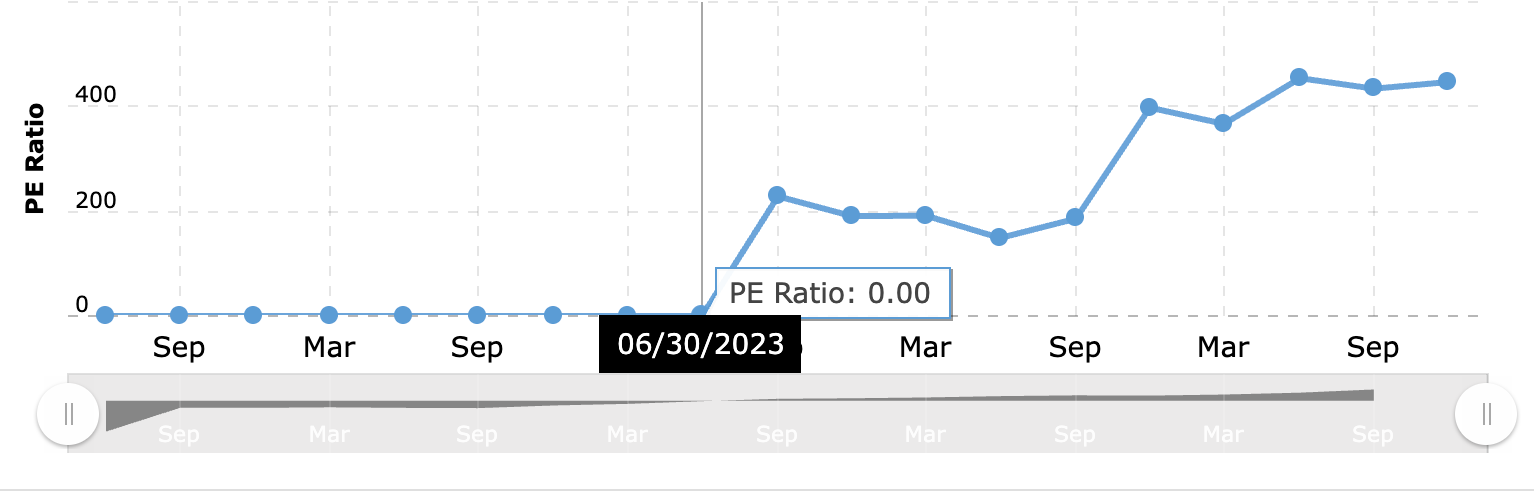
That doesn’t mean the market only noticed Palantir in 2023. It simply reflects the fact that Palantir was loss‑making for most of its public life, so a P/E ratio (price divided by positive earnings) was undefined. Once the company finally turned GAAP‑profitable, even a small profit on an already‑elevated share price produced a huge P/E print.
P/E is therefore a blunt tool for a “just‑turned‑profitable” company like this. However, if we switch to a cleaner metric for this stage of the business – price‑to‑sales (P/S) – the picture doesn’t suddenly become reassuring:
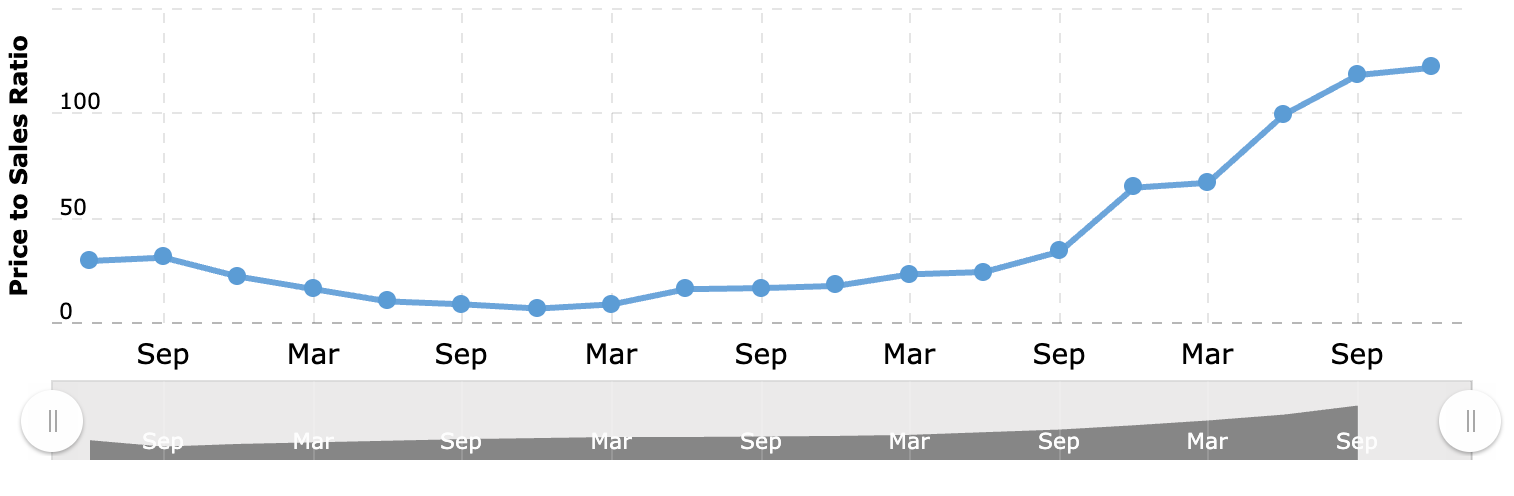
To the contrary, Palantir trades at a very high multiple of its revenues, which reinforces the point that today’s valuation embeds extremely optimistic expectations and looks truly elevated, if not outright absurd, relative to current fundamentals.
A broader observation here: investing always comes with risk, even in solid, consistently profitable businesses. With companies that are only barely at break‑even, those risks are amplified. Earnings forecasts are, by definition, just educated guesses about the future. When you buy a business with a long history of robust profits, you at least have some evidence that the machine works. When you buy a company that has recently engineered its way into a thin sliver of profitability, you are placing far more weight on projections, narratives, and hope. In Palantir’s case, you may be doing that and paying an eye‑watering multiple for the privilege.
So… is it safe to jump onto this ElevAItor?
We briefly took a look at several prominent companies from our ElevAIting Eleven list — Nvidia, Apple, Broadcom and Palantir — and examined their situation in the current market environment.
In the previous article we left you with a question:
“So, is it safe to jump onto this ElevAItor?”
Having now looked more closely at valuation through the lens of P/E (and, where P/E is useless, P/S), we can finally answer.
Across the ElevAIting Eleven, three patterns keep repeating:
Great businesses, demanding prices.
Names like Nvidia or Palantir may well be real businesses with strong technology, sticky customers, and attractive economics. Some are likely to be long‑term winners. But at 40‑plus earnings or 500‑plus earnings, you are not just buying quality, you are also buying a very specific view of the future. There is very little room for disappointment.Accounting smoke around fragile profitability.
Some of the ElevAIting Eleven are still just‑turned‑profitable on GAAP numbers, or rely heavily on adjustments and assumptions that can flip the story from loss to profit without any change in underlying cash economics. When the narrative leans this hard on adjusted metrics and index eligibility, caution – not FOMO – is usually the better instinct.Cycles, not straight lines.
AI is real (although not as perfect as many imagine), important and here to stay. But markets price stories in straight lines. Trees, as grandma reminds us, do not grow to the sky. Even if many of these companies continue to compound over time, the path for shareholders from today’s valuation starting point may involve long periods of dead money at best or very real drawdowns.
On top of this, there are now multiple warning signs that we are entering the final phase of an AI bubble. As quality‑focused investors, cautiously dealing with our own – and especially with other people’s – money, we would not be jumping onto that ElevAItor at this stage. On the contrary, we would be jumping out and staying away until the market cools down – most likely amid fletus et stridor dentium, the weeping and gnashing of teeth that accompanies a painful unwind when a catalyst finally arrives and the bubble bursts.
For patient investors, the more sensible stance is to:
respect the technology and the business quality where it exists,
keep these names on the watchlist,
and wait for prices – or expectations – to come back down to earth.
The ElevAItor will probably still be there after the next correction, although a bit tweaked and regrouped perhaps. Your capital will be too, ready to deploy, which is the whole point.
And if you prefer to stay fully invested, in our view there are several safer, higher‑quality bets currently priced very attractively. Capital is like liquid in communicating vessels: it had to rush into AI from somewhere1, and those “somewheres” — the parts of the market it rushed out of — are exactly where today’s opportunities are likely to be hiding.
Perhaps we can talk about it next time!
- Michał, CyberMoat
Uncovering risks, securing opportunities.
We recognise that a significant part of this “capital” was not patiently accumulated savings, but money effectively created out of thin air through credit expansion, fiscal deficits and monetary stimulus. From an Austrian‑leaning perspective, the alliance between government money‑printing (via debt and central‑bank policy) and Big Tech/asset markets has clearly helped to inflate this AI bubble. On top of that artificial liquidity, powerful amplifiers like FOMO and the rise of passive investing (which mechanically channels money flows into whatever is already big and expensive) further concentrate capital in the same names. Still, even with all this in the background, the classic mechanisms remain the same: herd behaviour, reflexivity, incentives and basic economic principles are all very much intact.